Map artists, clumsy search for the relationships in your data and how you can reinvent the wheel
Recently watched series video popularizer of mathematics. There, he tries to talk about the mathematical analysis and linear algebra a bit with the position of the man who "sort of" have invented it from scratch. That is, it tries to make available a simple and understood visualization of relatively complex concepts, as would explaining them from the perspective of a person who, like, invented it for the first time. Recently read article on habré about unsupervised learning and saw the section about Affinity Propagation. As it turned out, we used the method of cluster analysis intuitively, without even knowing it.
TLDR for this article. If you want an interactive visualization, use here.
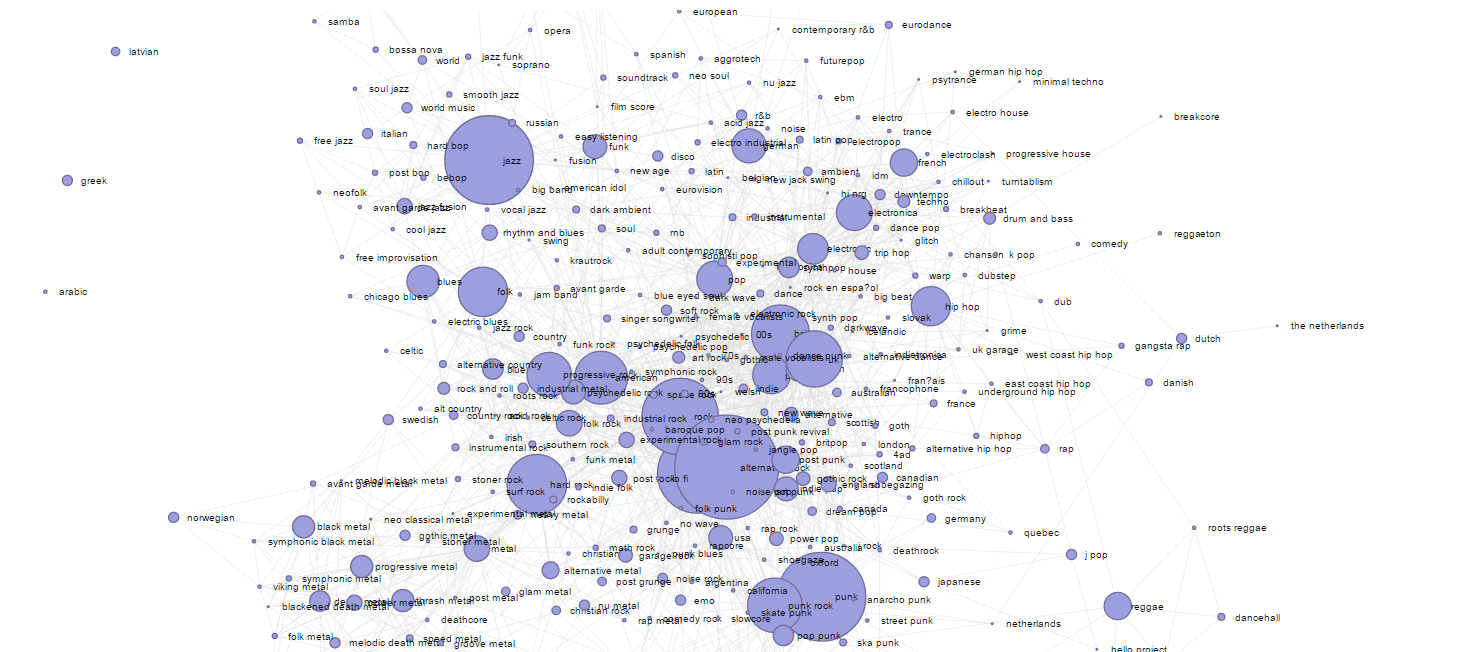
In this visualization graph illustrates the relationships between musical genres ~25,000 of the most popular artists in the world, and the size of the roundels shows the popularity of the genre, and the size of edges — the power of communication.
Eureka
This visualization is a rendering made on the library D3.js (we found a pattern), data on the similarity of the groups. The original data and the recursion can start here. The algorithm of data processing was about that (it was long ago, remember, in General terms, jpn did not use):
When we did, about Python and data science we didn't know (lolshto?) and everything was done with a combination of SQL queries, manipulation of CSV files and by multiplying the resulting matrices. When we have cleaned the database of the company and sent to all the cherished email, which was all described everything she had done and was shown the specified chart... in return we got nothing. No one asked a single question. All were simply indifferent. The data of our hard went to prod, extending the lifetime of the system tags for a couple of years (there was a severe debris, because there was no supervision and monitoring of fill data), and in response, we received the silent the silence and reproaches the format of "why we spent so much time on some shit?". The fact that such information is insanely useful for building recommendations, ratings of similarity, cross-sales and increasing relink on the website, too, passed unnoticed.
Then I remember the episode when one of the managers tried to enter feedback on the activities in the form of one star. It did not reach the implementation also for the reason described above. What's collaborative, filtering too =)
It was ridiculous and sad that we "found" a working algorithm and I made it to work on prod, but as they say all care.
Eureka two
The second point is similar to Eureka primitive algorithm of collaborative filtering (best on the knee he explained here in the form of an xlsx file). The idea of a "correct" algorithm works like this:
the
In practice, not knowing about it, and about Python, I did so. Expected something that had a Poisson distribution and tried to normalize it and lead to normal. Looks like this:

With a set of indicators looks like this:

Then linear and logistic regressions, I picked up weight. In fact it turns out a very rough analogue of this method, but instead of latent factors, there are some heuristics that I came up with fairly good statistical properties.
In General, if you do not understand, my idea is as follows:
Article based on information from habrahabr.ru
TLDR for this article. If you want an interactive visualization, use here.
In this visualization graph illustrates the relationships between musical genres ~25,000 of the most popular artists in the world, and the size of the roundels shows the popularity of the genre, and the size of edges — the power of communication.
Eureka
This visualization is a rendering made on the library D3.js (we found a pattern), data on the similarity of the groups. The original data and the recursion can start here. The algorithm of data processing was about that (it was long ago, remember, in General terms, jpn did not use):
-
the
- to Take the base Musicbrainz; the
- to Unzip it (if you want to contact, there is the unpacked copy in PostgreSQL about a year ago); the
- to Get the data of all artists, all albums with genres; the
- to Build the distributions of quantity of albums, genres, tracks for one artist. To build the distribution of the popularity of genres; the
- to Take the logarithms of these data and to clean them from obvious debris, rare or very frequent "garbage" values. the
- Then followed a number of steps associated with the base of the company where I worked, which are less important (in fact, we also have tied genres, cleaned our internal database of debris was put down values, etc. etc.); the
- Taking the measure of similarity number of the same genres of artists to construct a distance metric between i) artists ii) between genres; the
- In fact, as I recall, in practice we did a matrix multiplication of dimension ~25,000 rows; the
- In the end we got a measure of similarity of artists and music genres;
- Hand-placing and cluster analysis, we have merged the genres in the genres;
the Similarity of the actors was so-so, because the average artist has had more tags, but the similarity of the genres came out great; the
When we did, about Python and data science we didn't know (lolshto?) and everything was done with a combination of SQL queries, manipulation of CSV files and by multiplying the resulting matrices. When we have cleaned the database of the company and sent to all the cherished email, which was all described everything she had done and was shown the specified chart... in return we got nothing. No one asked a single question. All were simply indifferent. The data of our hard went to prod, extending the lifetime of the system tags for a couple of years (there was a severe debris, because there was no supervision and monitoring of fill data), and in response, we received the silent the silence and reproaches the format of "why we spent so much time on some shit?". The fact that such information is insanely useful for building recommendations, ratings of similarity, cross-sales and increasing relink on the website, too, passed unnoticed.
Then I remember the episode when one of the managers tried to enter feedback on the activities in the form of one star. It did not reach the implementation also for the reason described above. What's collaborative, filtering too =)
It was ridiculous and sad that we "found" a working algorithm and I made it to work on prod, but as they say all care.
Eureka two
The second point is similar to Eureka primitive algorithm of collaborative filtering (best on the knee he explained here in the form of an xlsx file). The idea of a "correct" algorithm works like this:
the
-
the
- Has sampling conditionally from movie reviews; the
- From a priori considerations, select the number of latent (unobserved factors) — let the people appreciate the films for 5 criteria; the
- Randomly generated weights, which mediate user-latent factor and the film-latent factor; the
- Also included in the model constant (bias values); the
- Method of gradient descent or its analogue is the optimization of weights (view xls file link above);
In practice, not knowing about it, and about Python, I did so. Expected something that had a Poisson distribution and tried to normalize it and lead to normal. Looks like this:
With a set of indicators looks like this:
Then linear and logistic regressions, I picked up weight. In fact it turns out a very rough analogue of this method, but instead of latent factors, there are some heuristics that I came up with fairly good statistical properties.
In General, if you do not understand, my idea is as follows:
-
the
- Do what you like; the
- don't listen to "advisors" and all those who "know better", but does nothing; the
- don't be discouraged if on your way you will meet shady characters, dark moments and dark situation; the
- Try to improve themselves and the world at least bit by bit every day;


Комментарии
Отправить комментарий